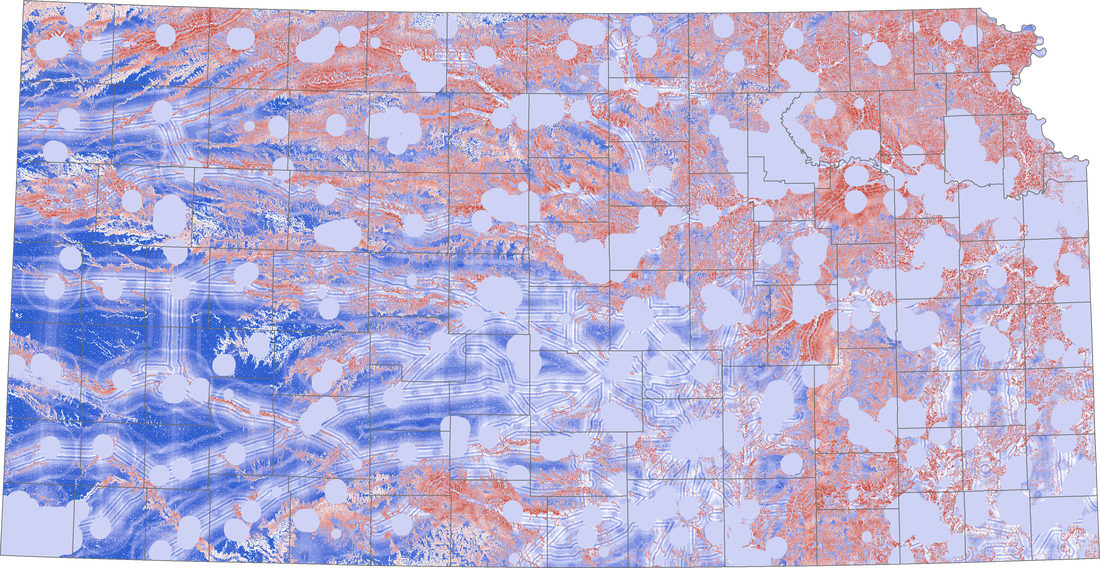
This map compares the two maps mentioned in weighting. It is the Equal weighted map minus the Weighted map. Areas in blue received a higher score from the weighed algorithm whereas the areas in red received a higher score from the equal weighted algorithm. Areas in lavender represent areas where both algorithms had the same score. Blue is concentrated in western Kansas because the low slope resulted in a relatively higher score in the weighted algorithm. The inverse is true to explain the red in eastern Kansas.