All of the Data Layers. We used a function named Near that tells us the distance from a certain point, our points were the turbines and the other variables were the other layers. After Near completed we got a data set of distances from point to feature we took that data and divided it into 1 km distances and measured the amount of points within the ranges. This was the basis for our classification and set up the standard.
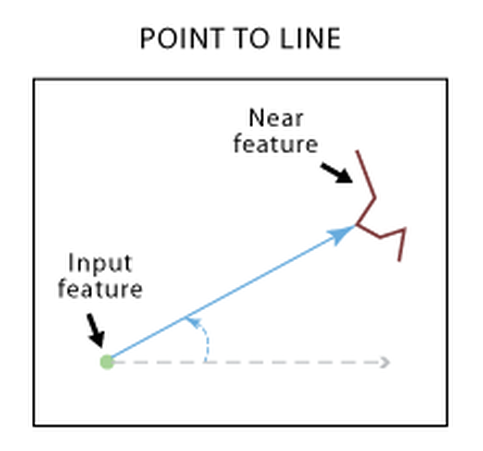
We made a data set with the location of all wind turbines within wind farms in Kansas. We used a function named Near to calculate the distance from each wind turbine to the closest feature. In this experiment, the features were the other data layers. After Near completed we got a data set of distances from the turbine points to the nearest feature. We took that data and divided it into 1 km intervals and measured the amount of points within each interval. This was the basis for our classification and set the standard for all of our data layers an example is in Table 1. below. After doing this we made a histogram with the data to see if there were any clear trends. in fact trends did appear such as Power Lines below in Graph 1
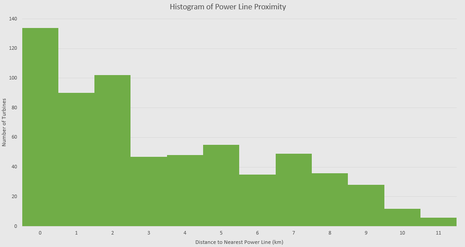
Graph 1
|
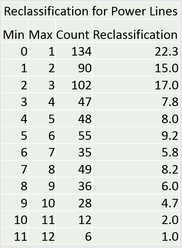
Table 1
|